Schedules, Legends & Quantities¶
Everything estimators and reviewers ask for is generated live from the plan itself — schedules, legends, reference tables, and CSV takeoffs all read the same markup store the map does, so they update the moment the design changes.
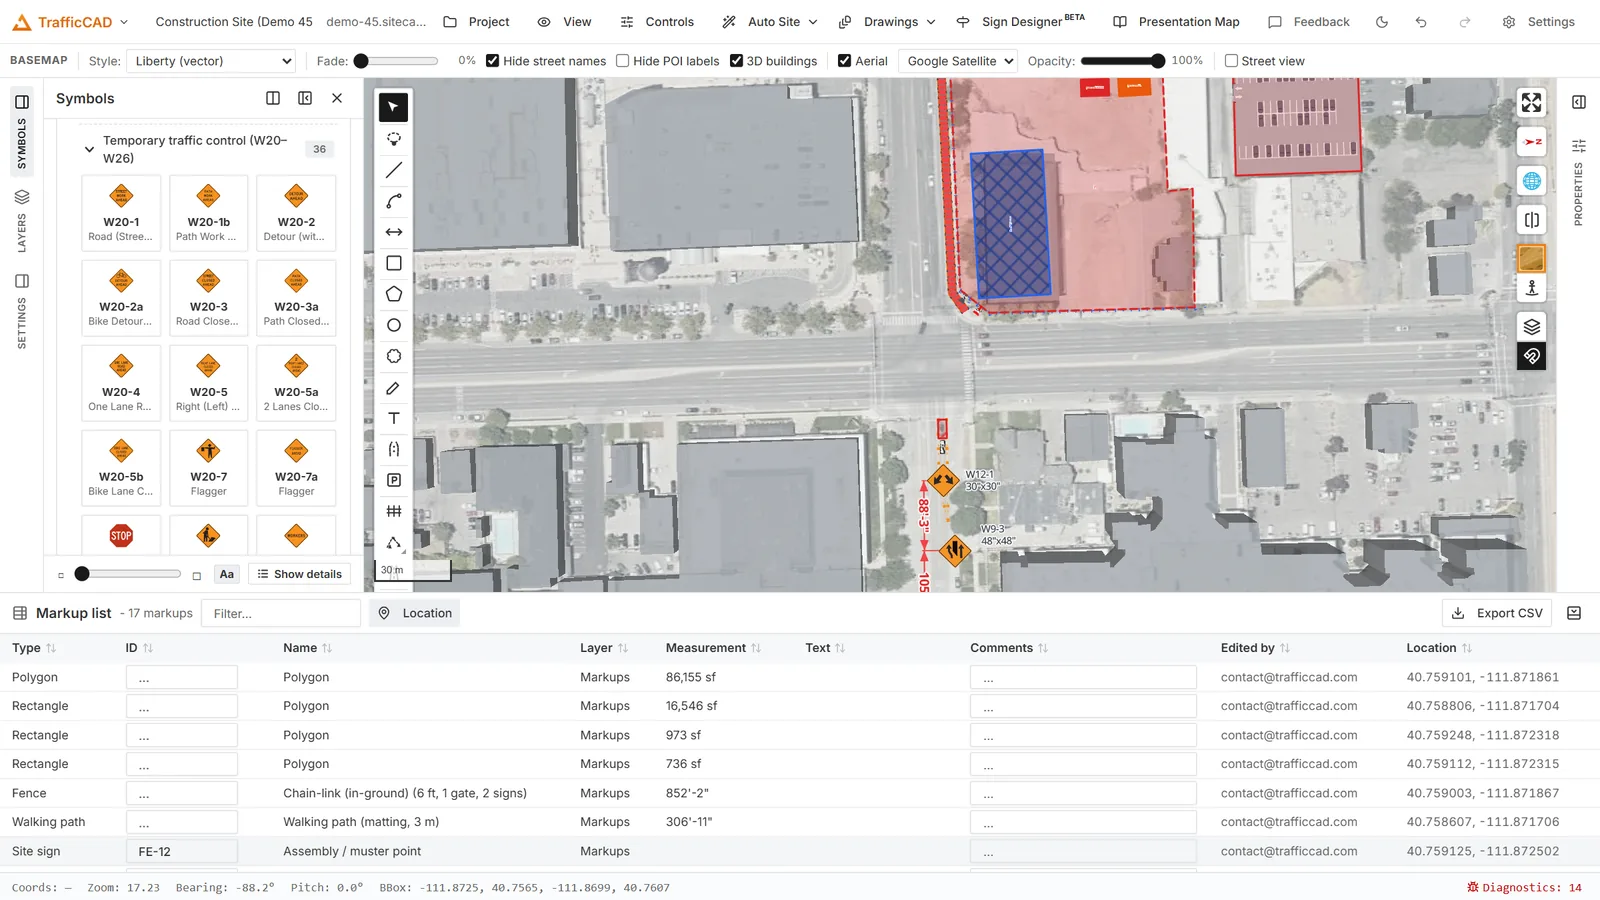
The Markups List: every markup and sign with its type, ID, layer, measurement, and location — filterable, sortable, and exportable as CSV.
Sign schedule¶
Add it from the Drawings top bar: Tables… → Sign schedule. The table is titled SIGN SCHEDULE with columns:
| SIGN | CODE | DESCRIPTION | SIZE | MOUNTING | QTY |
|---|---|---|---|---|---|
| (glyph) | W20-1 | Road Work (with distance) | 48"×48" | Portable stand | 4 |
- The SIGN column draws the actual sign face at table scale.
- MOUNTING summarizes each sign's support (see Sign Mounting); the same sign on two different supports or heights schedules as separate rows, exactly how a crew needs it.
- Quantities count signs on visible layers — hide a phase layer and the schedule reflects it.
Device schedule¶
Tables… → Device schedule adds the DEVICE SCHEDULE:
| SYMBOL | DEVICE | MUTCD | QTY |
|---|---|---|---|
| (glyph) | Drum | §6K.06 | 28 |
Device counts come from the actual spacing runs — channelizer lines and TTC plan chains count every station. Arrow boards schedule per support ("(trailer-mounted)" vs truck-mounted).
MUTCD reference tables¶
Also under Tables… — cited reference tables to print beside the plan, so the reviewer doesn't need the book open:
- ADVANCE WARNING SIGN SPACING (Table 6B-1) — ROAD TYPE / A / B / C
- TAPER LENGTH CRITERIA (Tables 6B-3/6B-4) — with Speed (mph) and Offset W (ft) inputs in the inspector so the lengths match your job
- CHANNELIZING DEVICE SPACING (§6K.01) — LOCATION / MAX SPACING
- BUFFER SPACE (LONGITUDINAL) (Table 6B-2) — SPEED (MPH) / BUFFER (FT)
Legends¶
Two legend items populate themselves from visible-layer markups:
- Sign legend — a table titled SIGN LEGEND: sign glyph, CODE — NAME, DIMS, QTY, NOTES. The inspector's Lists dropdown switches between Signs (table), Markups (no signs), and Everything (classic); column toggles turn Dimensions / Count / Notes on and off, and every row's text and notes are editable.
- Markup legend — titled LEGEND: one row per distinct device symbol, area kind (WORK AREA, BUFFER / SAFETY ZONE, DETOUR, MARKED AREA), and road type (TEMPORARY ROAD / DETOUR), with counts.
Markup list & CSV¶
The Bluebeam-style markup table is always docked at the bottom of the app as a slim Markup list bar — click its expand button to open the table, and re-dock it the same way. Every markup and sign lists with columns Type, ID, Name, Layer, Measurement, Text, Comments, Location:
- Click a row to select the markup and fly the map to it.
- The ID cell is editable — it renames just that one markup (the sign or device itself is unchanged) and defaults to the sign/device code. Clear it to restore the default.
- The Comments cell is editable — notes write back onto the feature and export with the CSV.
- Measurement shows what makes sense per type: sign face size, measured length for lines and routes, area for polygons and zones.
- Location is each markup's latitude/longitude; the header-bar Location button hides or shows the column (remembered per device).
- Click a column header to sort (click again for descending, a third time to clear); the Filter… box narrows the table across every column.
- Export CSV downloads
markup-list.csv— the rows as filtered and sorted, plus Latitude/Longitude columns — for spreadsheets and estimating systems.
TTC plans appear in the list with their TA code and zone area.
Fence bill of materials¶
Every fence run computes a per-component BOM — posts, rails, fabric
rolls, footings/ballast, bracing assemblies, gates and hardware, screen
material — grouped by category in the Selected fence panel, with an
Export CSV button (Fence, System, Category, Component, Qty, Unit,
Note). See Fencing & Site Protection.
Quantities follow visibility
Schedules, legends, and counts read visible sketch layers. Use layer visibility to phase your takeoffs: show Phase 1, export; show Phase 2, export again.