Measure & Document a Site
Every plan carries quantities: how long that closure is, how much pavement gets restriped, how many square feet of staging area the contractor gets. This tutorial turns a set of markups into a document that answers those questions on the sheet and in a spreadsheet — in about ten minutes.
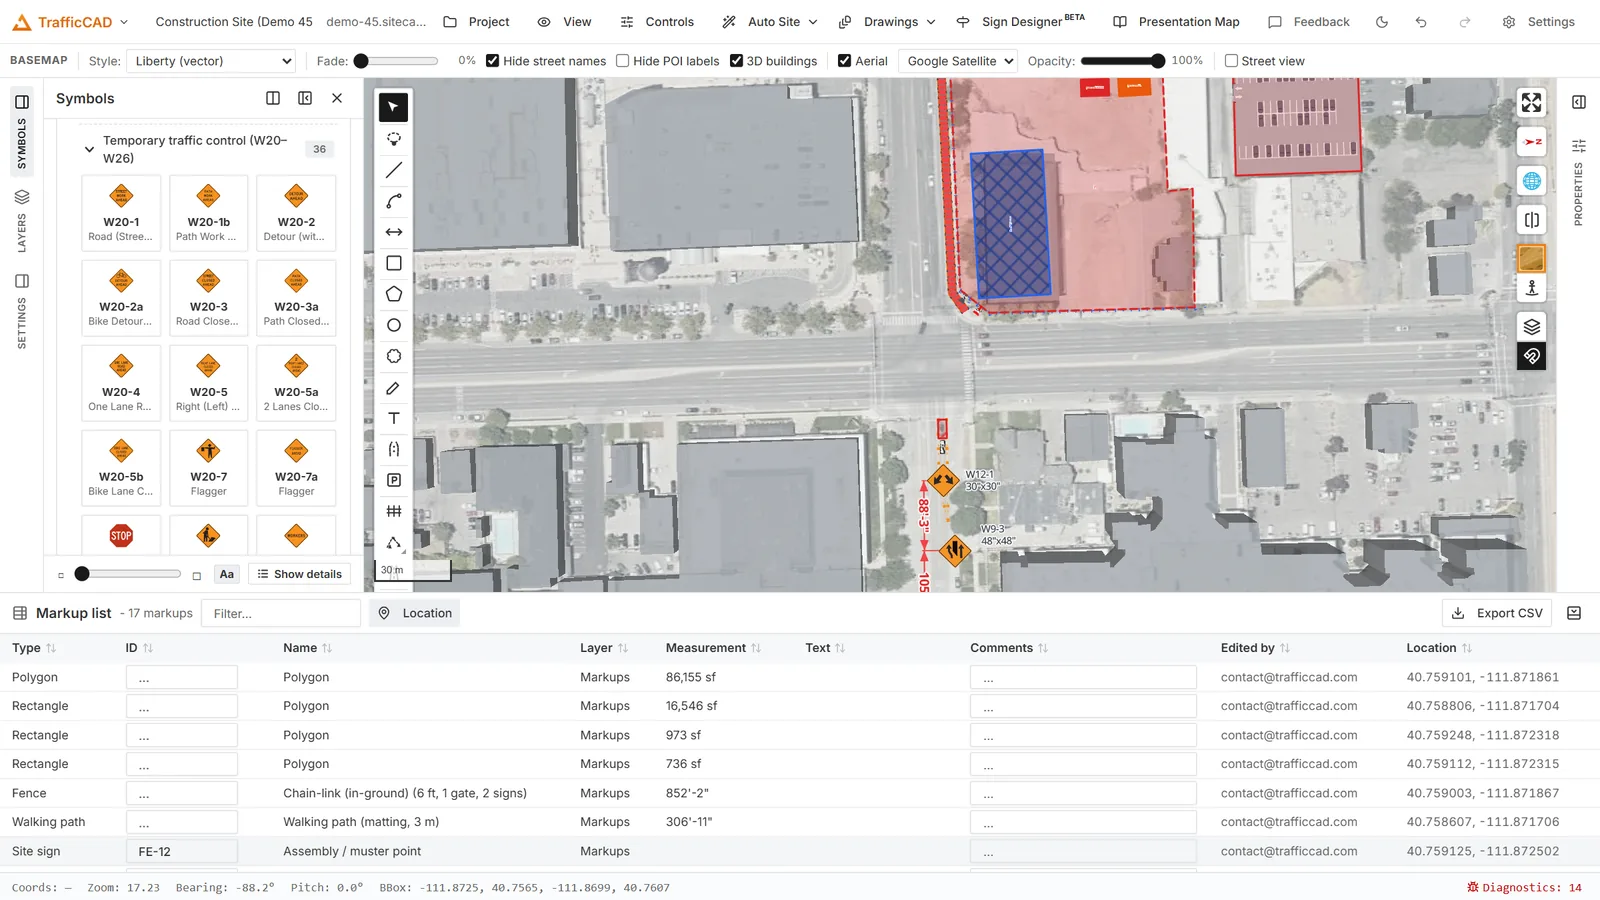
Where this ends up: every markup with its measurement, filterable and exportable as a CSV with coordinates.
1. Draw what you need to quantify
Zoom to the site and draw three things with the markup tools:
- a polyline along the length of the closure,
- a rectangle over the staging area,
- a polygon around an irregular no-parking zone.
Style them however you like for now — the numbers come next.
2. Turn measurements on
Select the polyline. In the Properties panel, find the Measurements block and tick Show measurements.
The measured value appears on the markup immediately, on the map, on sheets, and in exported PDFs. It is a live readout: reshape the markup and the number follows.
Now do the same for the rectangle and the polygon. Notice that the Show dropdown offers different choices depending on the shape:
| Shape | Options under Show |
|---|---|
| Line, polyline | Length |
| Rectangle, polygon | Area, Perimeter, Area + perimeter |
| Circle | Area, Diameter, Area + diameter |
Set the rectangle to Area + perimeter — a staging area usually needs both, one for the surfacing quantity and one for the fence run.
3. Break a run into segments
Select the polyline again and tick Segment values. Each leg of the polyline now prints its own length alongside the total.
This is the difference between "the closure is 640 ft" and "the closure is 200 ft of taper, 300 ft of work space, and 140 ft of termination" — the second one is what a crew can actually stake out.
Segment values on a polygon
Segment values work on a polygon's sides too, as long as its perimeter is being shown. Handy for a fence line where each run is a separate order.
4. Set the units you report in
The Length unit and Area unit dropdowns override the project default for that one markup. Leave them on the default for everything except the exceptions — a metric detail on an otherwise imperial plan, or an area you want in acres rather than square feet.
Precision controls how many decimals print. Round in the drawing, not in your head.
Once a markup looks right, Set as default pushes its whole style — measurement settings included — onto the tool, so the next markup you draw starts there. Use project default puts a markup back on the project settings.
Where the project default lives
The project-wide units and precision are on the left rail's Settings panel, under Measurements. Per-markup overrides always win over that.
5. Read the whole set at once
At the bottom of the app sits the Markup list bar. Click its expand button.
Every markup and sign in the project is now a row, with columns for Type, ID, Name, Layer, Measurement, Text, Comments, Location. Your three markups are there with their measured values in the Measurement column.
- Click a row to select the markup and fly the map to it.
- Click the Type header to sort, so all the polygons group together.
- Type in the Filter… box to narrow the table across every column.
6. Label the rows for the estimator
Two columns are editable, and both are worth filling in before a takeoff leaves your hands:
- ID — rename a row to something the estimator recognises:
CL-01,STAGE-A,NP-ZONE-1. This renames that one markup only; a sign's underlying code is untouched. Clear it to go back to the default. - Comments — notes that ride with the feature and export with the CSV. "Night work only", "contractor to confirm width".
7. Export the takeoff
Click Export CSV. TrafficCAD downloads markup-list.csv containing
the rows as filtered and sorted, plus Latitude and Longitude columns
for every markup.
That last part matters: the spreadsheet you hand over is not just quantities, it is quantities with locations — every row can be dropped into a GPS, a field report, or another mapping system.
Filter before you export
The export honours the filter. Type STAGE in Filter… and
export, and you get just the staging items — one CSV per trade, from
one plan.
8. Put a table on the sheet
The CSV is for the estimator; the reviewer wants it on the drawing. In the Drawings workspace, add a legend item and set its Lists dropdown to Markups (no signs) — the table populates itself from the visible-layer markups, with Dimensions, Count, and Notes columns you can toggle on and off. Every row's text and notes stay editable on the sheet.
Now the reviewer sees the drawing and its quantities on one page.
Reference: Markup Tools & Styles · Dimensions & Callouts · Schedules, Legends & Quantities
Next steps: Publish & Share to get the sheet set out the door.